
The User Lifetime Value (LTV) report in Google Analytics 4 helps evaluate how much value different groups of users bring to a business over time.
Table of Contents
- Dimensions and metrics used in the LTV report
- Examples of questions LTV report can answer
- Which acquisition sources bring users with the highest long-term value?
- Which campaigns drive repeat engagement, not just initial visits?
- Which channels generate the most transactions over time?
- How does user engagement evolve after acquisition?
- How is value distributed across users (not just averages)?
- What is the expected future behavior of users?
- How does GA4 calculate user Lifetime Value?
- How to read LTV report
Instead of focusing on single sessions or transactions, this report shifts the perspective to long-term performance. It shows how users acquired through specific channels or campaigns contribute to revenue across their entire lifecycle.
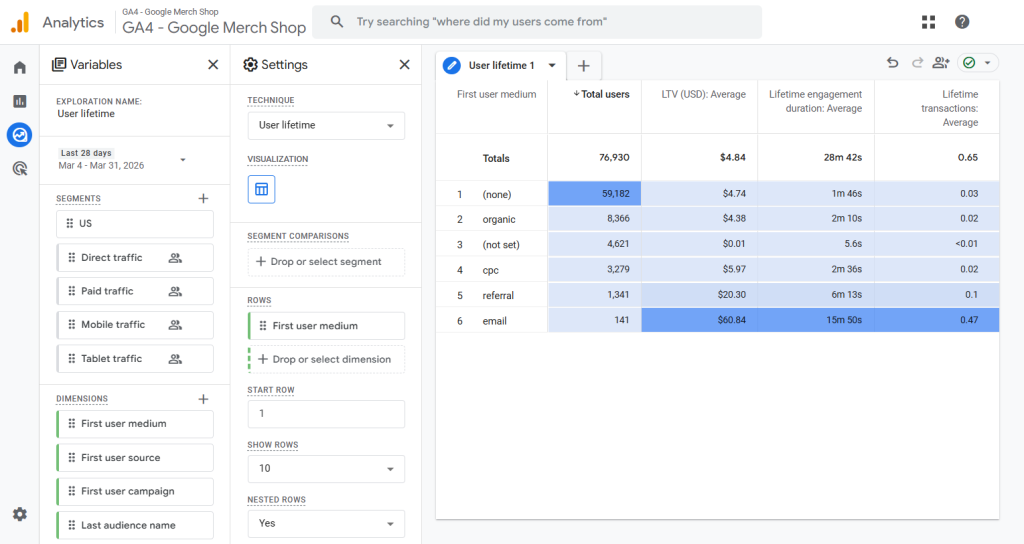
The LTV report is available in the Explorations section under the “User lifetime” template. Once selected, Google Analytics 4 automatically generates a pre-configured exploration with a standard set of dimensions and metrics. This provides a starting point, but the real value comes from customizing it based on specific business questions.
Used correctly, this report helps identify which acquisition sources generate the highest long-term return and supports more informed budget allocation decisions. Over time, this contributes to improving overall return on ad spend (ROAS).
It is important to consider seasonality when interpreting results. Periods with unusually high conversion rates, such as Black Friday, can significantly skew lifetime value calculations and should be analyzed separately when possible.
At its core, Lifetime Value represents the cumulative revenue generated by a user. Each purchase increases that value, including recurring transactions such as subscriptions, where every billing cycle contributes to the user’s total LTV.
Dimensions and metrics used in the LTV report
Dimensions
- First user source
- First user medium
- First user campaign
- First visit date
- First purchase date
- Last purchase date
- Last audience name
- Last platform
Metrics
- Active users
- Total users
- User lifetime (LTV) (all use: total, average, 10th, 50th, 80th, 90th percentile)
- LTV
- User lifetime (engagement & behavior) (all use: total, average, 10th, 50th, 80th, 90th percentile)
- Lifetime sessions
- Lifetime engaged sessions
- Lifetime engagement duration
- Lifetime session duration
- Lifetime transactions
- User lifetime (monetization) (all use: total, average, 10th, 50th, 80th, 90th percentile)
- Lifetime ad revenue
- Predictive (all use: average, 10th, 50th, 80th, 90th percentile)
- Churn probability
- Purchase probability
- In-app purchase probability
- Predicted revenue
The “LTV” metric represents total revenue generated by users over time. It should not be confused with “Lifetime ad revenue”, which only includes ad monetization and is not relevant for most ecommerce setups.
| Percentile | What it means | How to interpret |
|---|---|---|
| 10th percentile | Value that 90% of users exceed | Shows the low end of user value (weak users) Example: if LTV = $5 → 10% of users generate $5 or less, 90% generate more |
| 50th percentile (median) | Middle value (50% above, 50% below) | Represents the typical user Example: if LTV = $100 → half of users generate less than $100, half generate more |
| 90th percentile | Value that only top 10% exceed | Shows high-value users driving performance Example: if LTV = $500 → 90% of users generate $500 or less, only top 10% generate more |
Questions LTV report can answer
The User Lifetime report helps evaluate how different acquisition groups perform over time, using lifetime engagement, transactions, and revenue signals.
It answers questions such as:
Which acquisition sources bring users with the highest long-term value?
Compare source / medium or campaign to identify where high-value users come from.
Set First user source / medium or First user campaign as a dimension and compare LTV (average / 50th / 90th percentile) or Lifetime transactions.
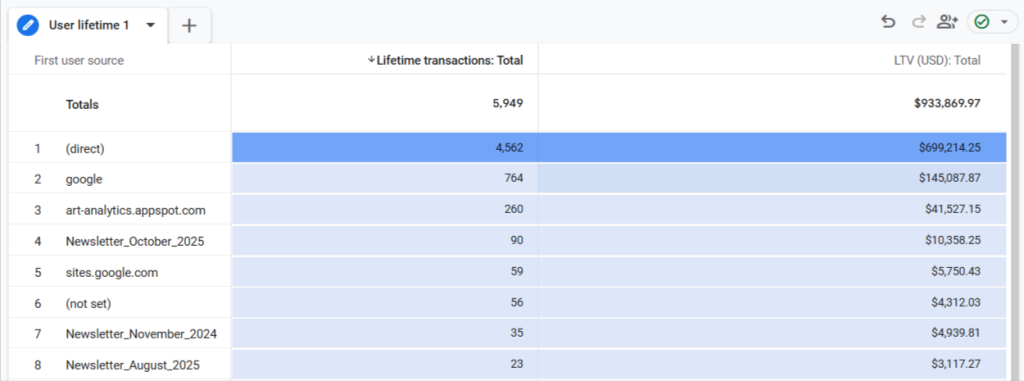
Example interpretation:
- direct → 4,562 transactions / $699K LTV → drives the highest total value;
- google → 764 / $145K → strong contributor, but far behind direct.
Conclusion: Direct traffic generates the highest total revenue and transactions; Google is the strongest acquisition channel after direct; newsletters and smaller sources contribute less volume but still add incremental value.
Which campaigns drive repeat engagement, not just initial visits?
Use lifetime sessions and engagement metrics to understand whether users keep coming back.
Set First user campaign as a dimension and compare Lifetime sessions and Lifetime engaged sessions (average / 50th percentile).
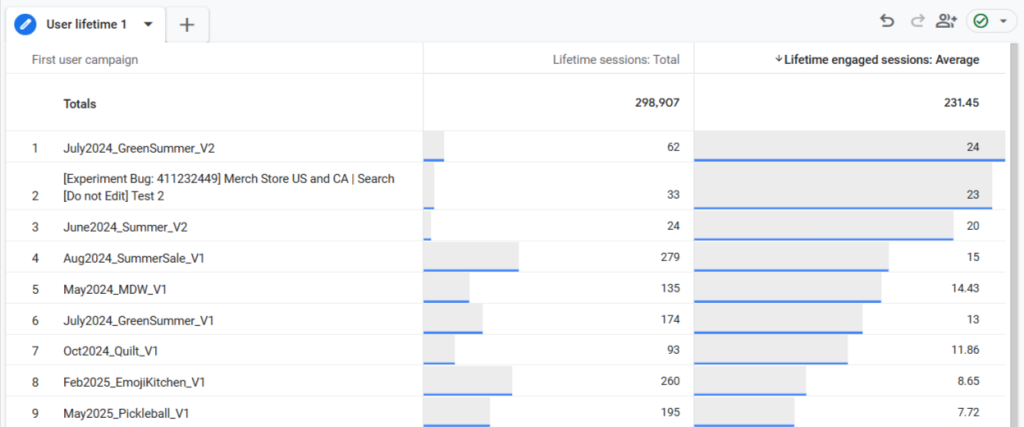
Example interpretation:
July2024_GreenSummer_V2 → 24 engaged sessions → users from this campaign come back and engage the most. Some campaigns bring traffic, but users don’t return or engage much after their first visit.
Which channels generate the most transactions over time?
Evaluate lifetime transactions to see which sources lead to repeated purchases.
Set First user source / medium as a dimension and compare Lifetime transactions (average / 50th / 90th percentile).
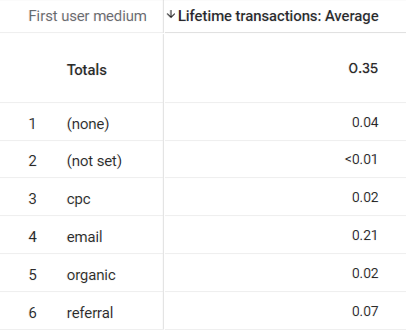
Example interpretation:
- email → 0.21 → on average, each user acquired via email makes 0.21 transactions;
- referral → 0.07 → ~3x lower than email.
Conclusion: email clearly brings the highest-quality users in terms of repeat purchases. Other channels mostly drive one-time or low-frequency buyers.
How does user engagement evolve after acquisition?
Analyze lifetime engaged sessions and engagement duration to understand long-term behavior.
Set First user source / medium or First user campaign as a dimension and compare Lifetime engaged sessions and Lifetime engagement duration (average / 50th percentile).
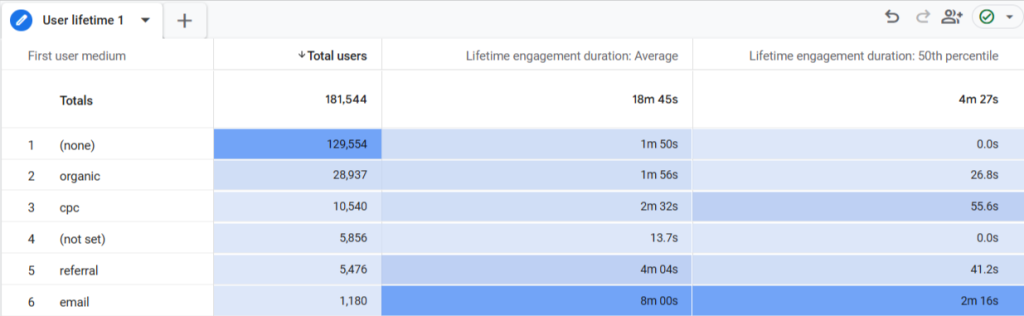
Example interpretation:
- email → 8m avg / 2m 16s median → highest engagement, users stay and return;
- referral → 4m avg / 41s median → good engagement, but less consistent;
- cpc → 2m 32s avg / 56s median → moderate engagement;
- organic → 1m 56s avg / 27s median → lower engagement;
- (none) → 1m 50s avg / 0s median → most users don’t engage beyond first interaction.
Conclusion: email drives the most engaged users over time; referral performs well but is less consistent; CPC and organic bring lower-engagement users; direct traffic has the weakest engagement quality.
How is value distributed across users (not just averages)?
Use percentiles (10th, 50th, 80th, 90th) to identify whether performance is driven by a small group of high-value users.
Set First user source / medium or First user campaign as a dimension and compare LTV (50th vs 90th percentile).
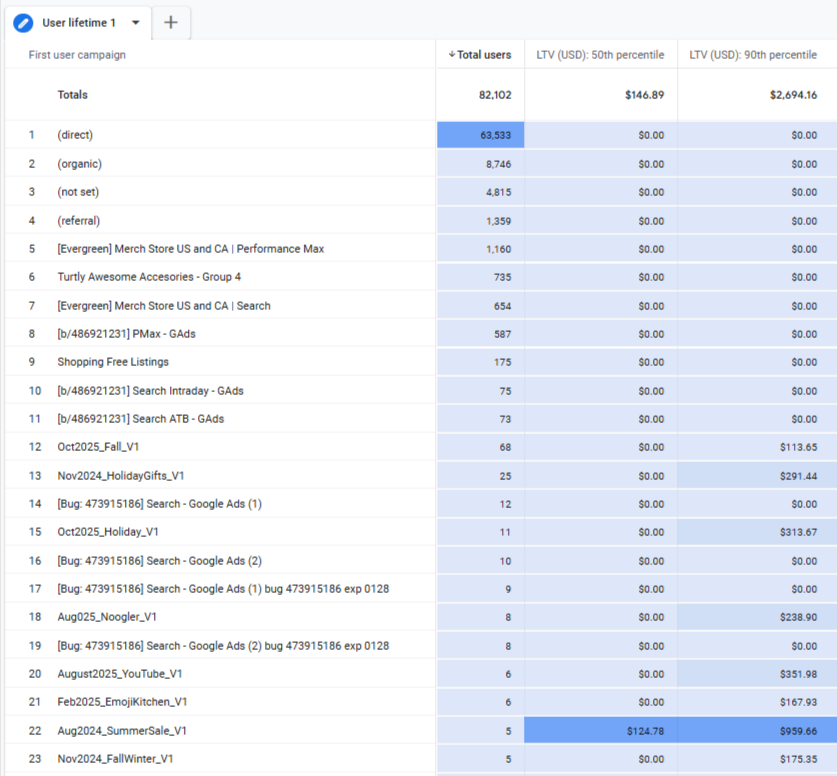
Example interpretation:
- Totals → $146 (50th) vs $2,694 (90th) → very large gap → value driven by top users;
- Most campaigns → $0 (50th & 90th) → the majority of users don’t generate revenue;
- Oct2025_Fall_V1 → $0 vs $113 → only a few users generate value;
- Nov2024_HolidayGifts_V1 → $0 vs $291 → stronger high-value users;
- Aug2024_SummerSale_V1 → $124 vs $959 → both typical and high-value users exist.
Conclusion: Revenue is driven by a small group of high-value users; most campaigns bring users with no or very low value; only a few campaigns generate consistently valuable users.
What is the expected future behavior of users?
Use predictive metrics (churn probability, purchase probability, predicted revenue) to estimate future value.
Set First user source / medium or First user campaign as a dimension and compare Purchase probability and Churn probability (average).
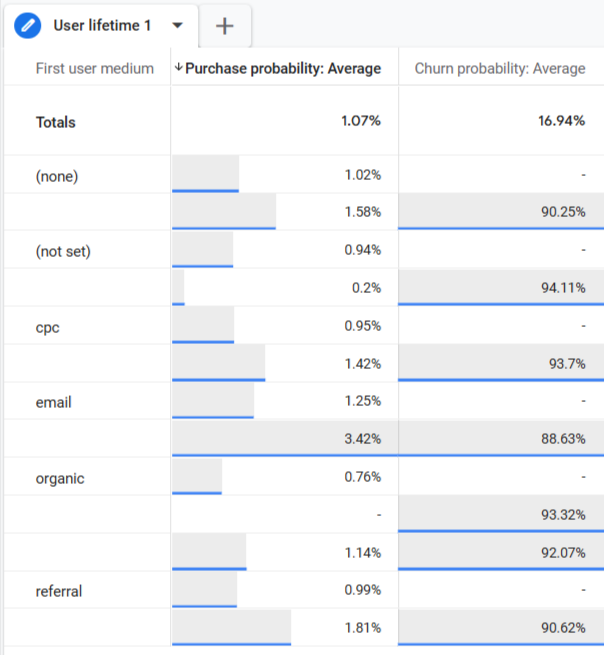
Example interpretation:
- email → 3.42% purchase / 88.6% churn → highest chance to convert again, relatively lower churn;
- referral → 1.81% / 90.6% → moderate repeat potential;
- cpc → ~1.4% / 93.7% → lower conversion, higher churn;
- organic → 0.76% / 93.3% → lowest likelihood to purchase again.
Conclusion: email users are most likely to return and purchase again; organic and CPC users have the highest churn risk; predictive data confirms that email drives the highest future value.
How does GA4 calculate user Lifetime Value?
In Google Analytics 4, User Lifetime Value (LTV) is calculated as the average revenue generated per user within a group.
It is based on two components:
- Rₜ — total revenue generated by a group of users
- Uₜ — total number of users in that group
LTV shows average value per user, not total revenue. Higher LTV means higher-quality users, not necessarily more users.
How to read LTV report
The LTV report in Google Analytics 4 should be used for comparison, not absolute values. The goal is not to understand if a number is “good”, but to see which acquisition sources or campaigns bring higher-quality users.
Start with LTV, focusing on average and percentiles. The average shows overall value, but it can be skewed by a small number of high spenders. That’s why it’s important to compare it with the 50th percentile (median) and 90th percentile. If there is a large gap between them, most revenue is coming from a small group of users.
Then look at Lifetime transactions to understand whether users actually purchase multiple times. This helps separate channels that drive one-time buyers from those bringing repeat customers.
Engagement metrics such as lifetime sessions or engaged sessions add another layer. High engagement usually indicates better retention and stronger long-term value, even before purchases happen.
Finally, predictive metrics like purchase probability and churn probability can be used to validate patterns. If a channel shows strong LTV and also high purchase probability, it is likely to continue performing well.
Overall, the report is most useful when comparing acquisition sources to identify which ones bring users who return, engage, and generate value over time.